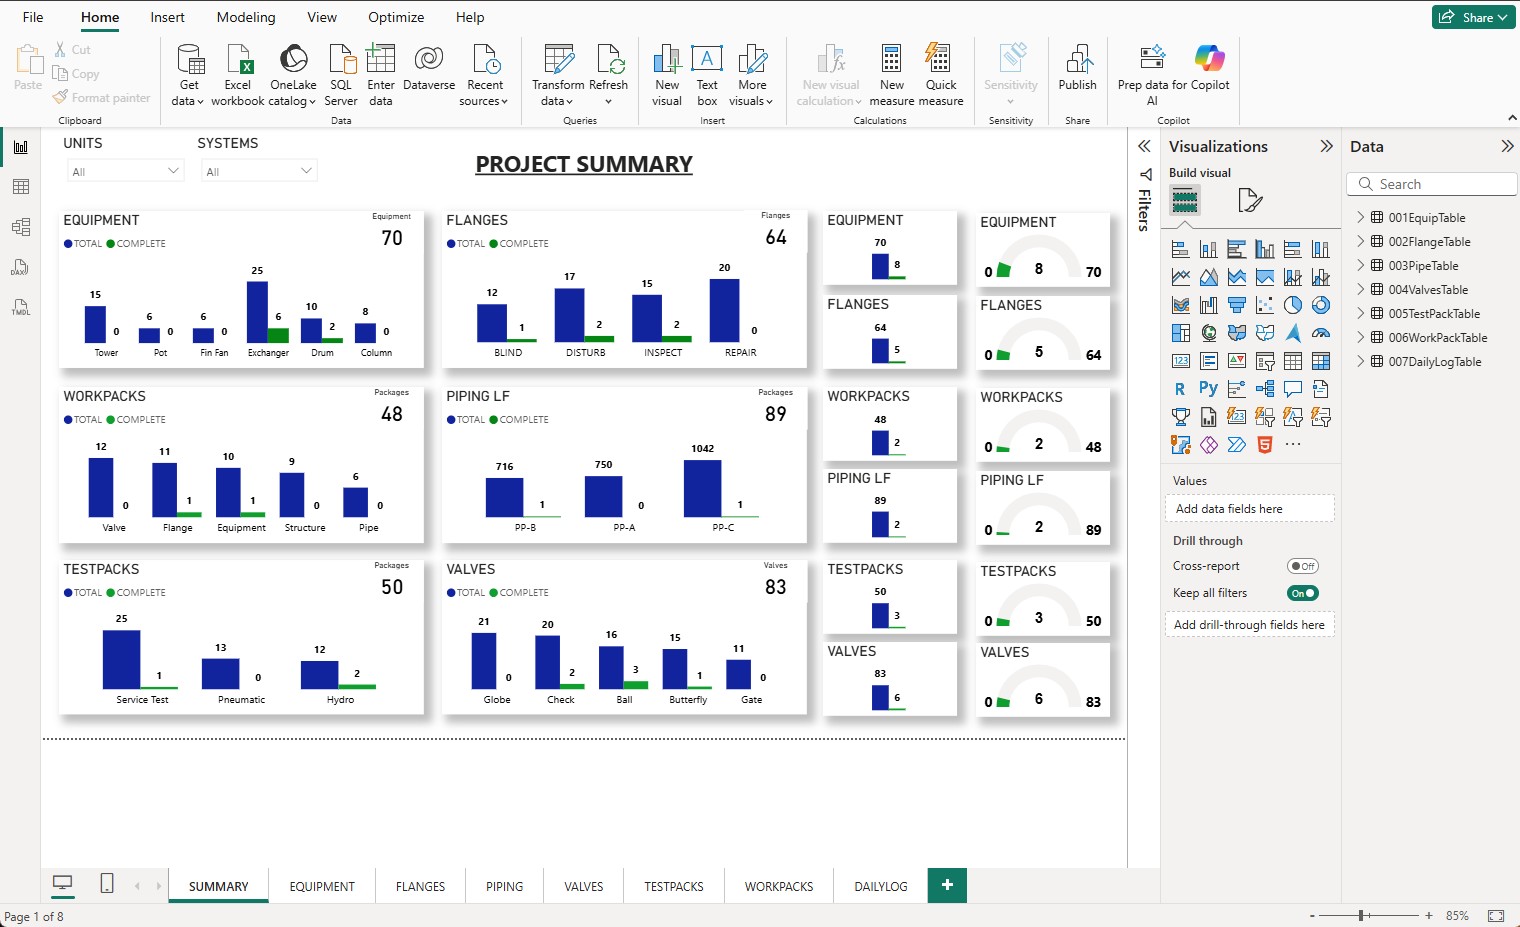
Executive Project Controls
High-level visibility into budget, actuals, commitments, milestones, and overall health.

Executive-ready reporting built for schedule, cost, field progress, and project controls.
High-level visibility into budget, actuals, commitments, milestones, and overall health.
Track baseline versus current plan, milestone slippage, earned progress, and key trends.
Compare approved budget, commitments, actual spend, and forecast at completion in one view.
Daily progress, productivity, blockers, and site updates — structured for fast reporting.
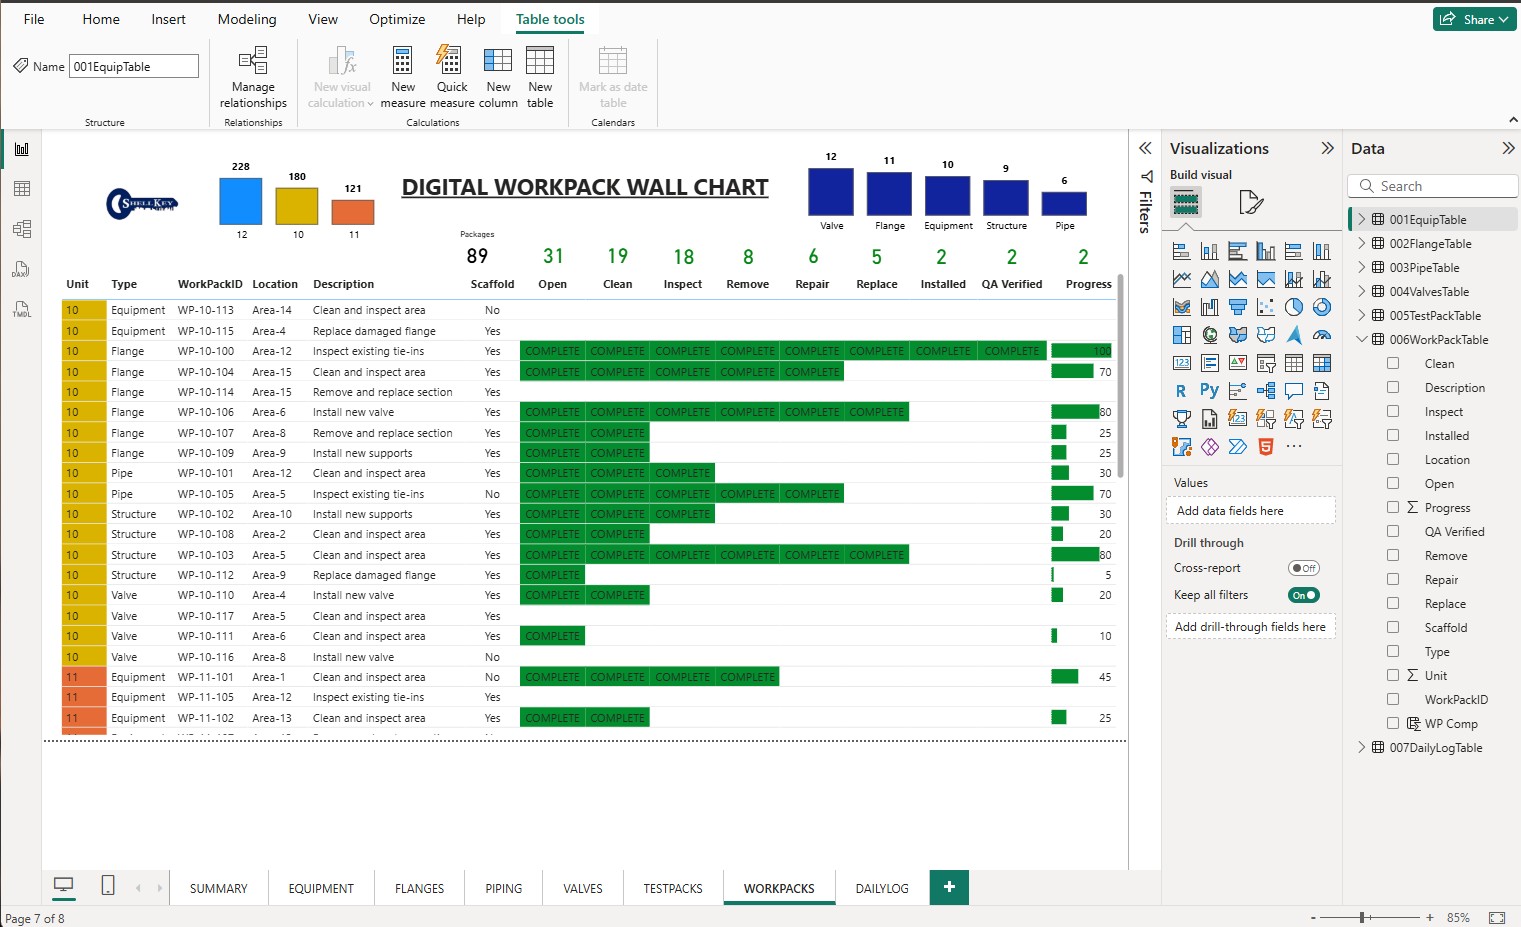
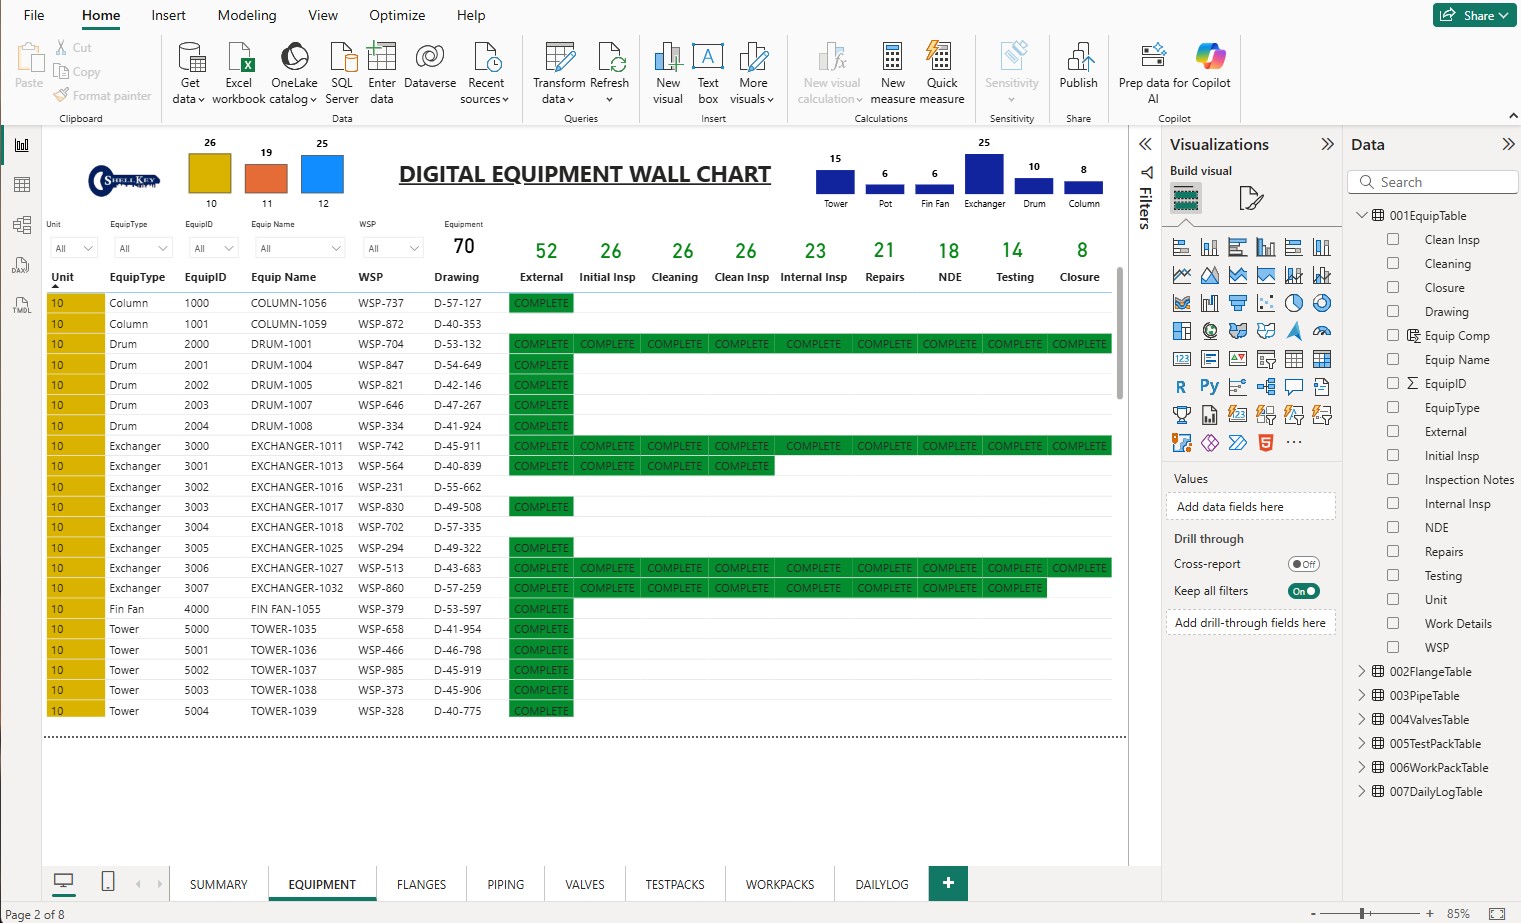
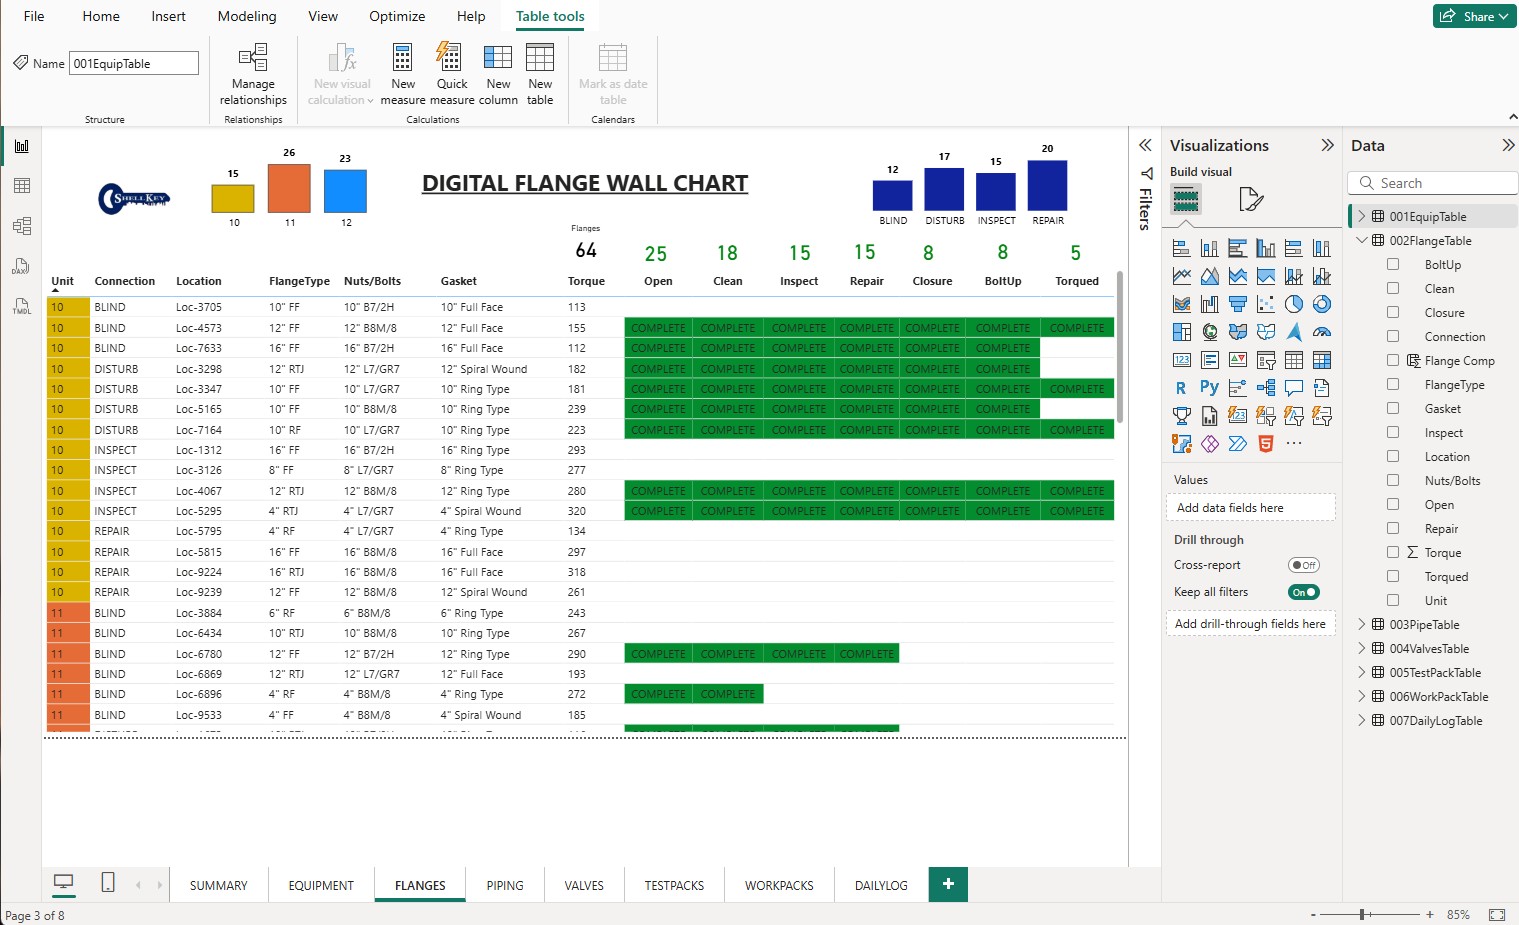
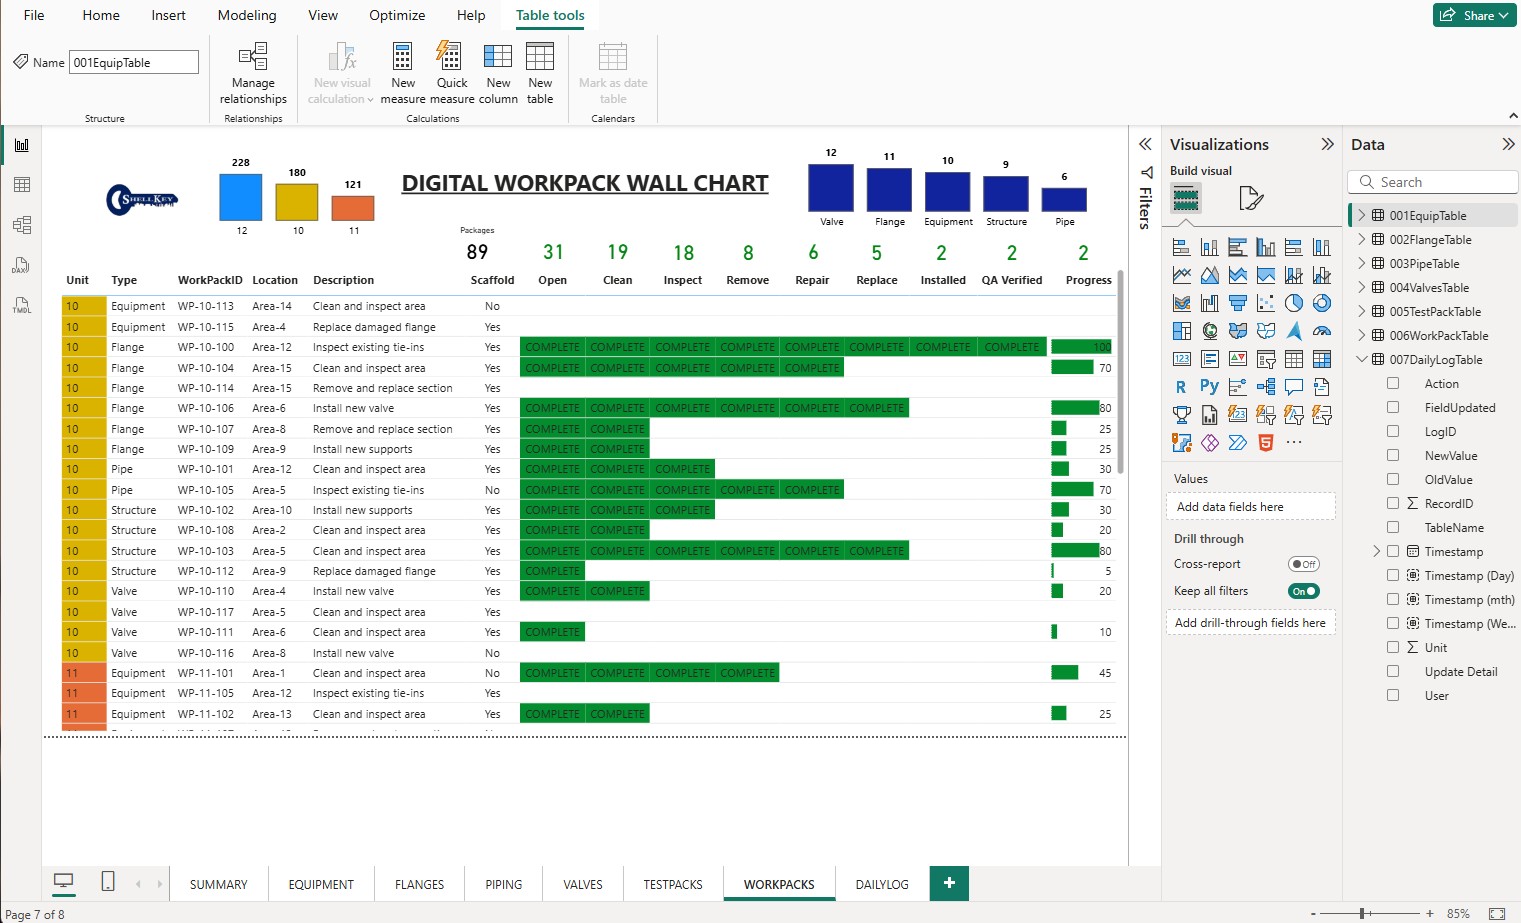
Track workpack status end-to-end: planned → released → executed → closed with proof.
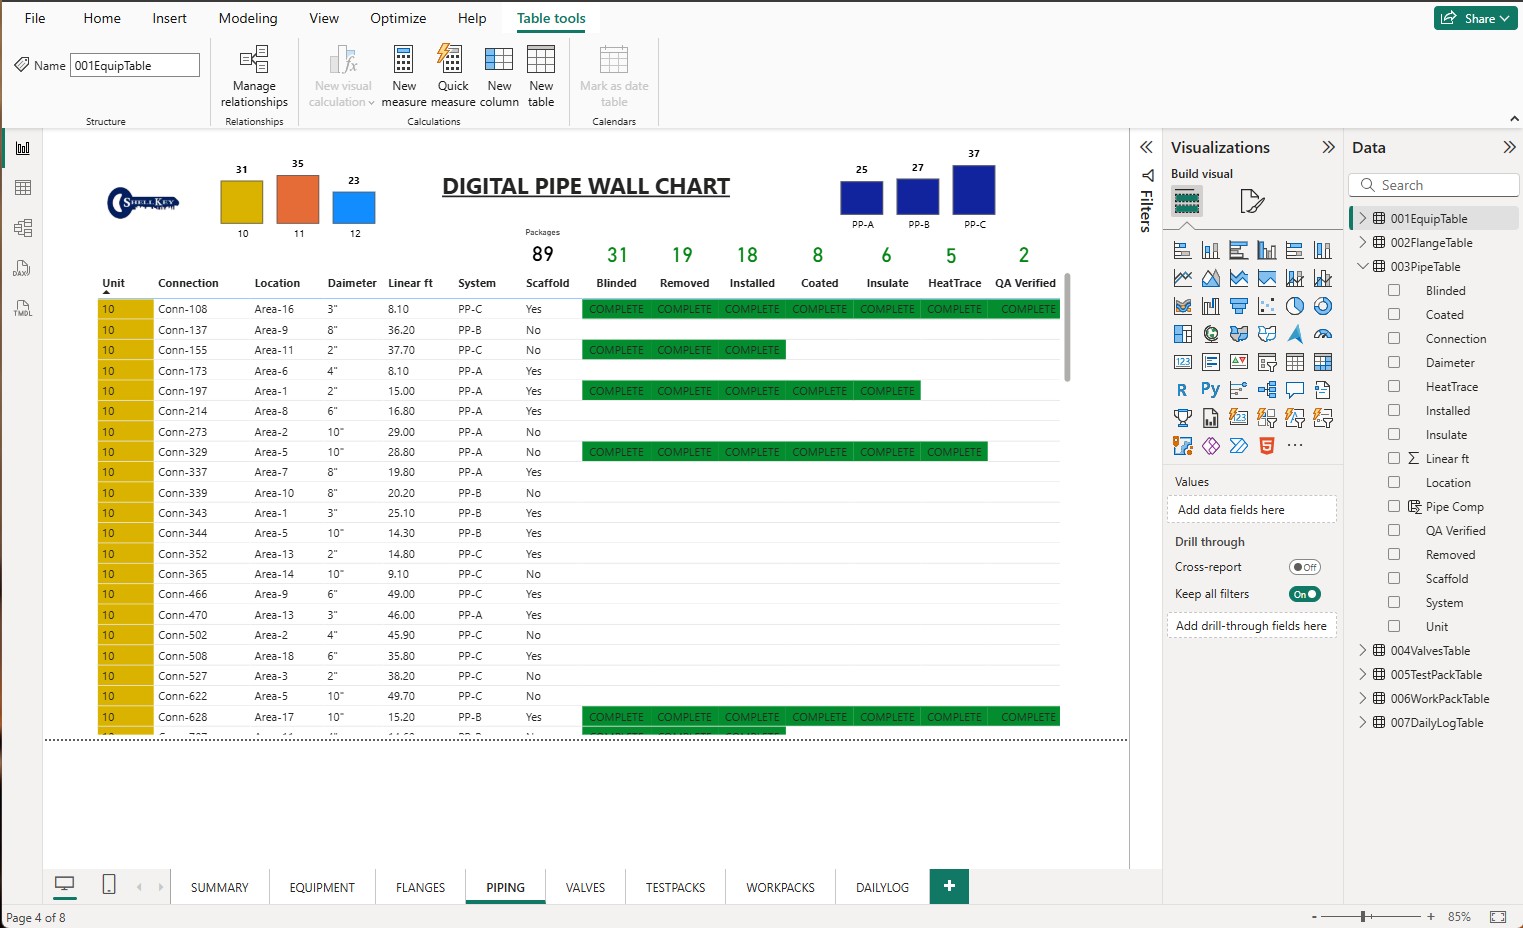
See what’s holding work back: materials, permits, access, engineering, inspections, and more.
Mobile and web apps designed to simplify field data capture and improve reporting speed.
Capture requests, status, priorities, and completions from the field with a simple workflow.
Centralize inspection logs, punch items, approvals, and reporting across disciplines.
Turn field inputs into clean dashboards and weekly reporting without manual rework.
Shell Key builds digital systems for industrial project controls, reporting, and execution.
We help teams improve visibility across schedule, cost, progress, inspections, and field reporting.
Our solutions are designed for industrial capital projects, outages, maintenance, and construction execution.
Better data flow means faster reporting, stronger decision-making, and fewer surprises for project leadership.
From dashboards to mobile apps, Shell Key focuses on practical systems people will actually use.
Request a demo or ask a question. We’ll respond fast.
Email: Kirby.Billiot@shellkey.company
Phone: +1 (337) 254-8321
Business hours: Mon–Fri 8am–5pm