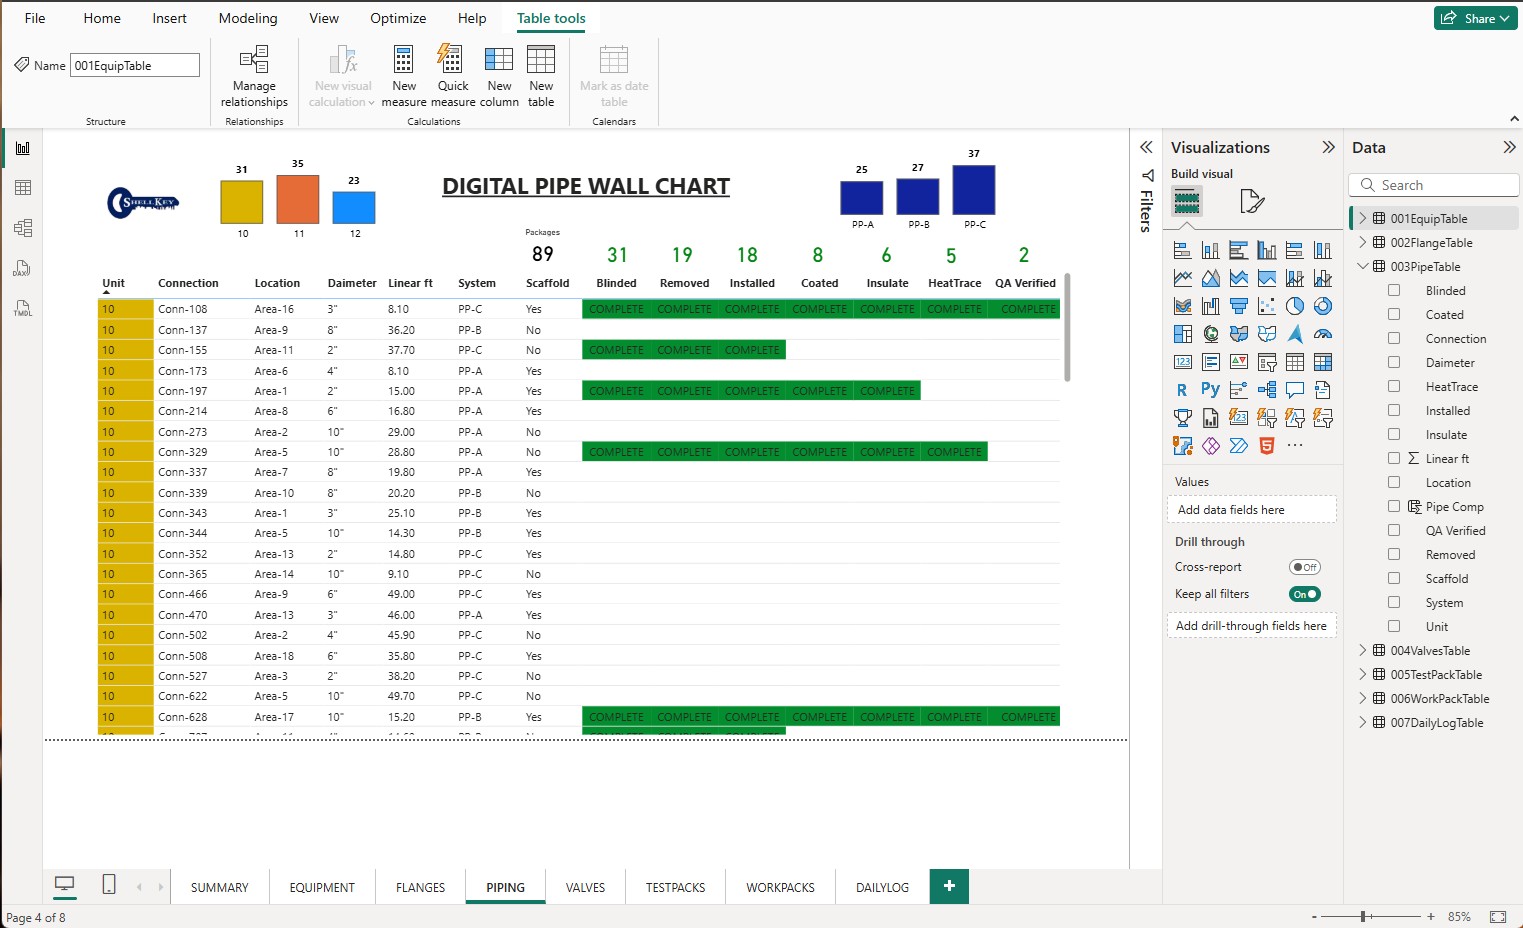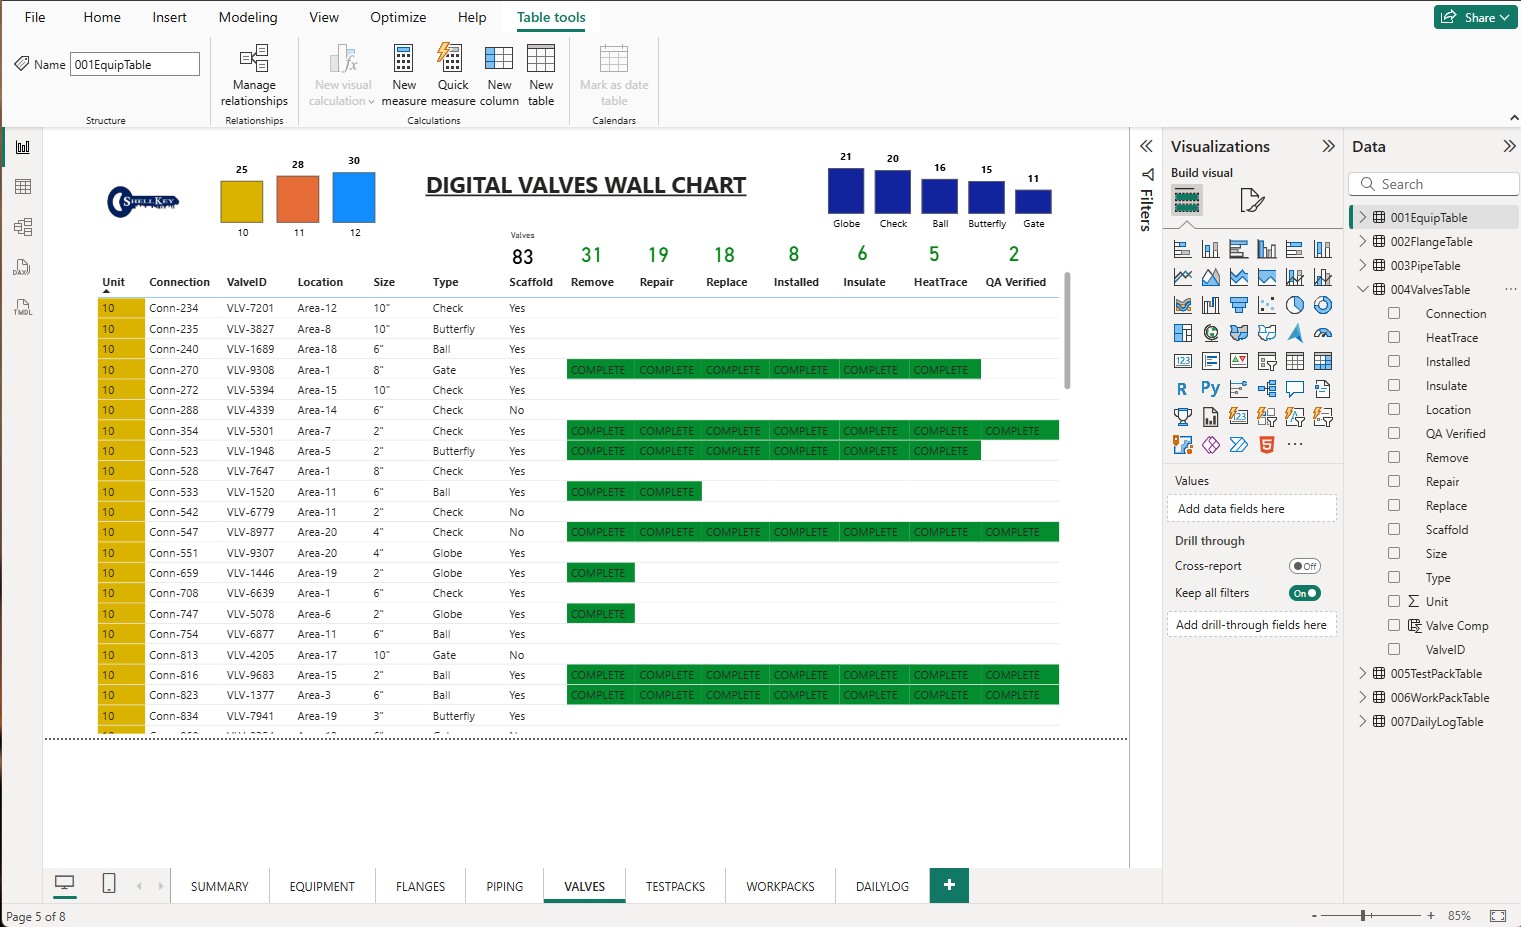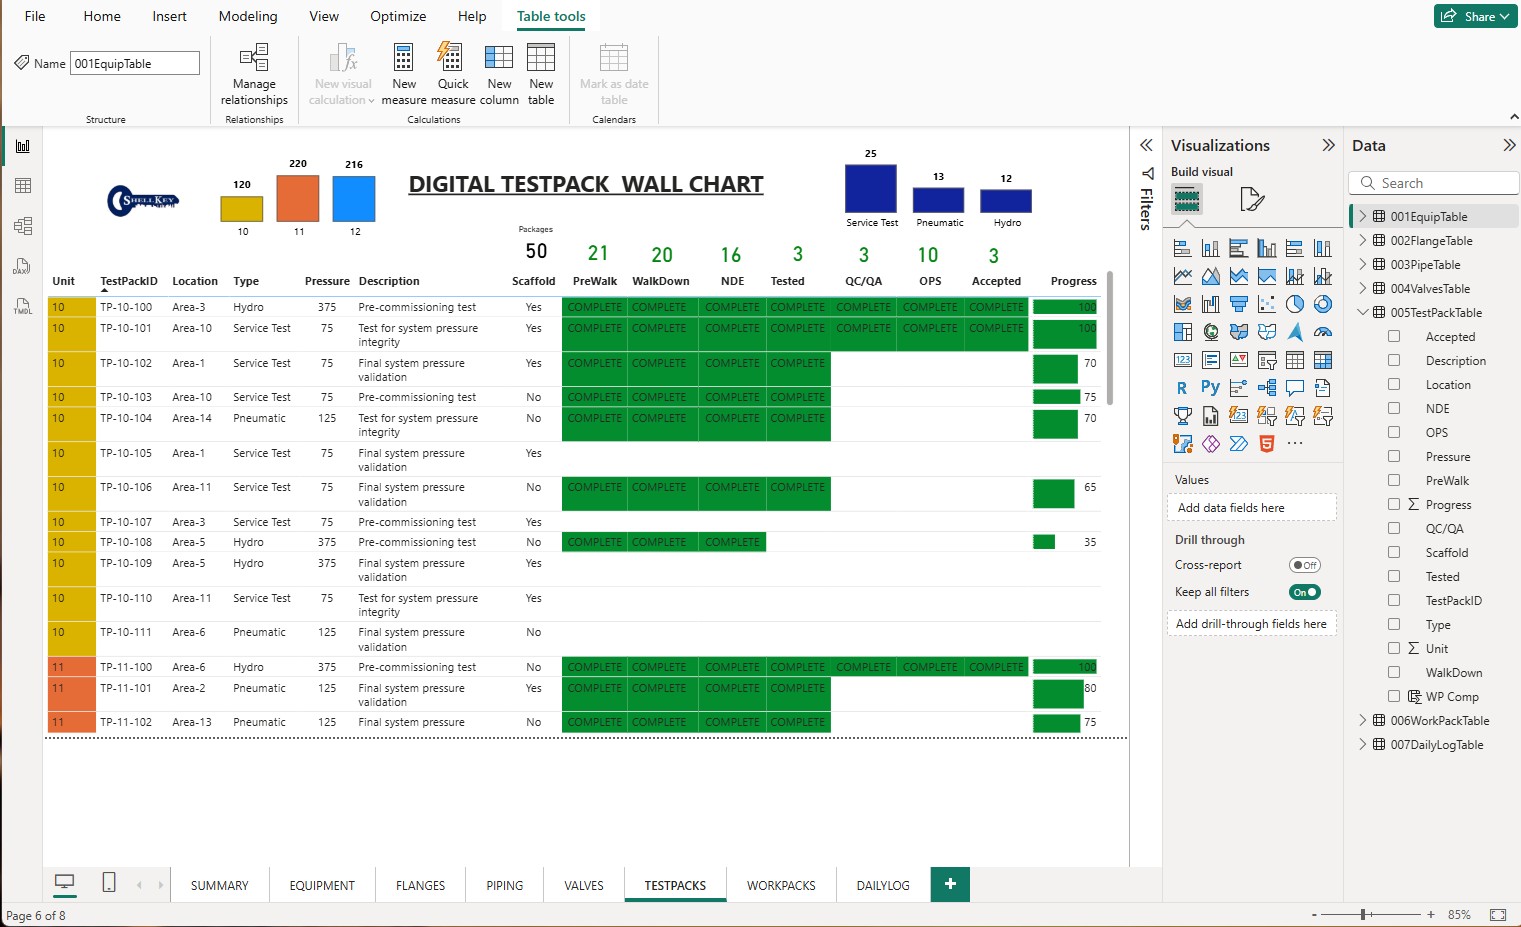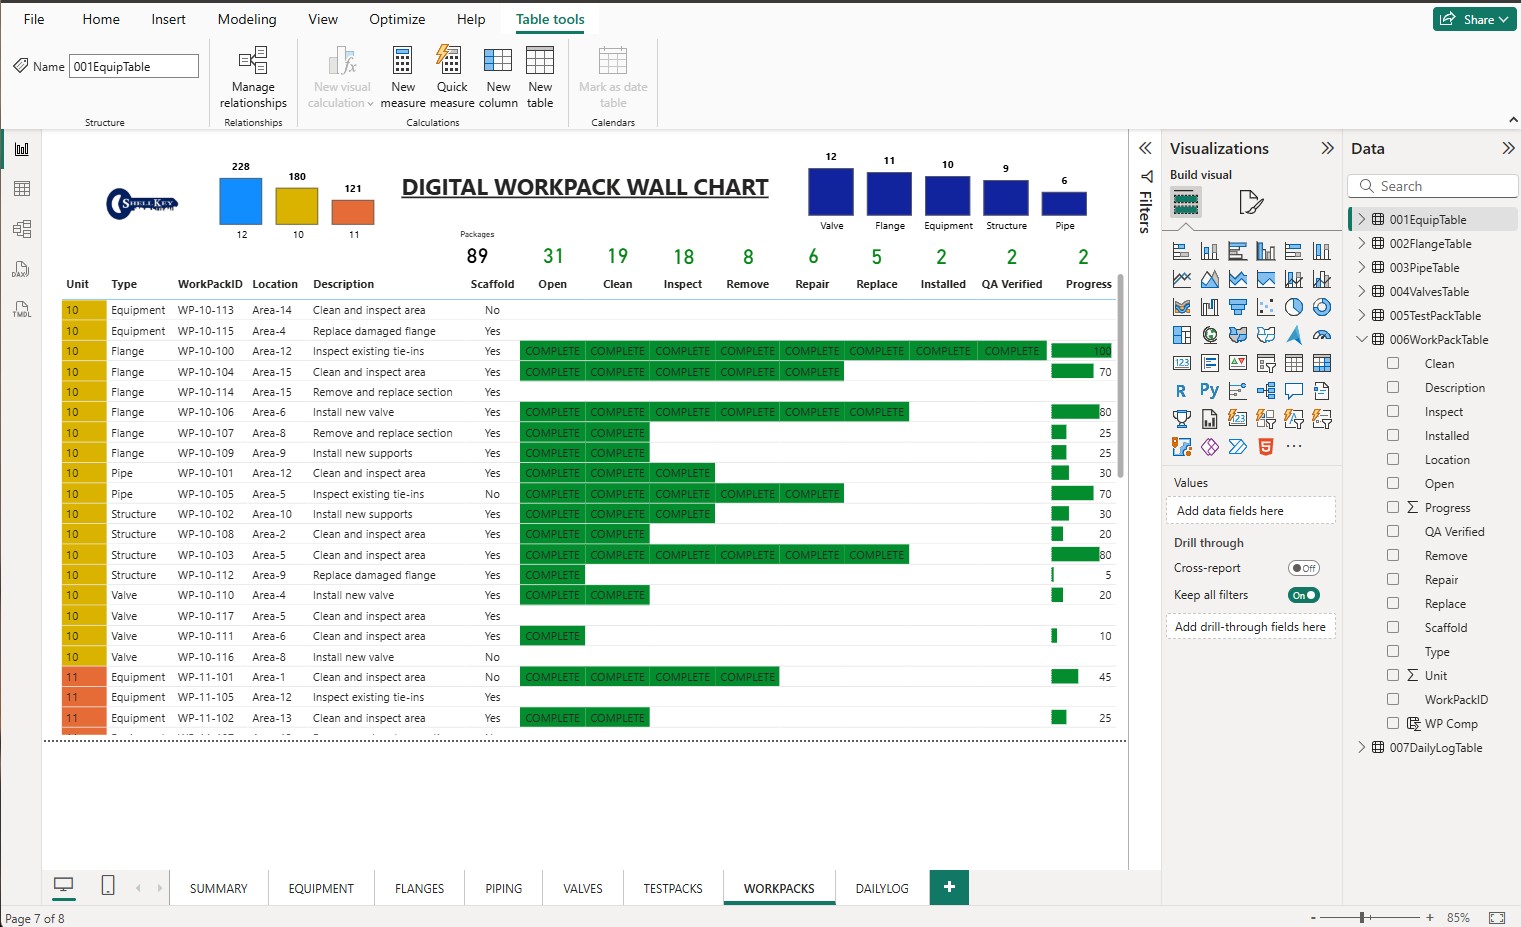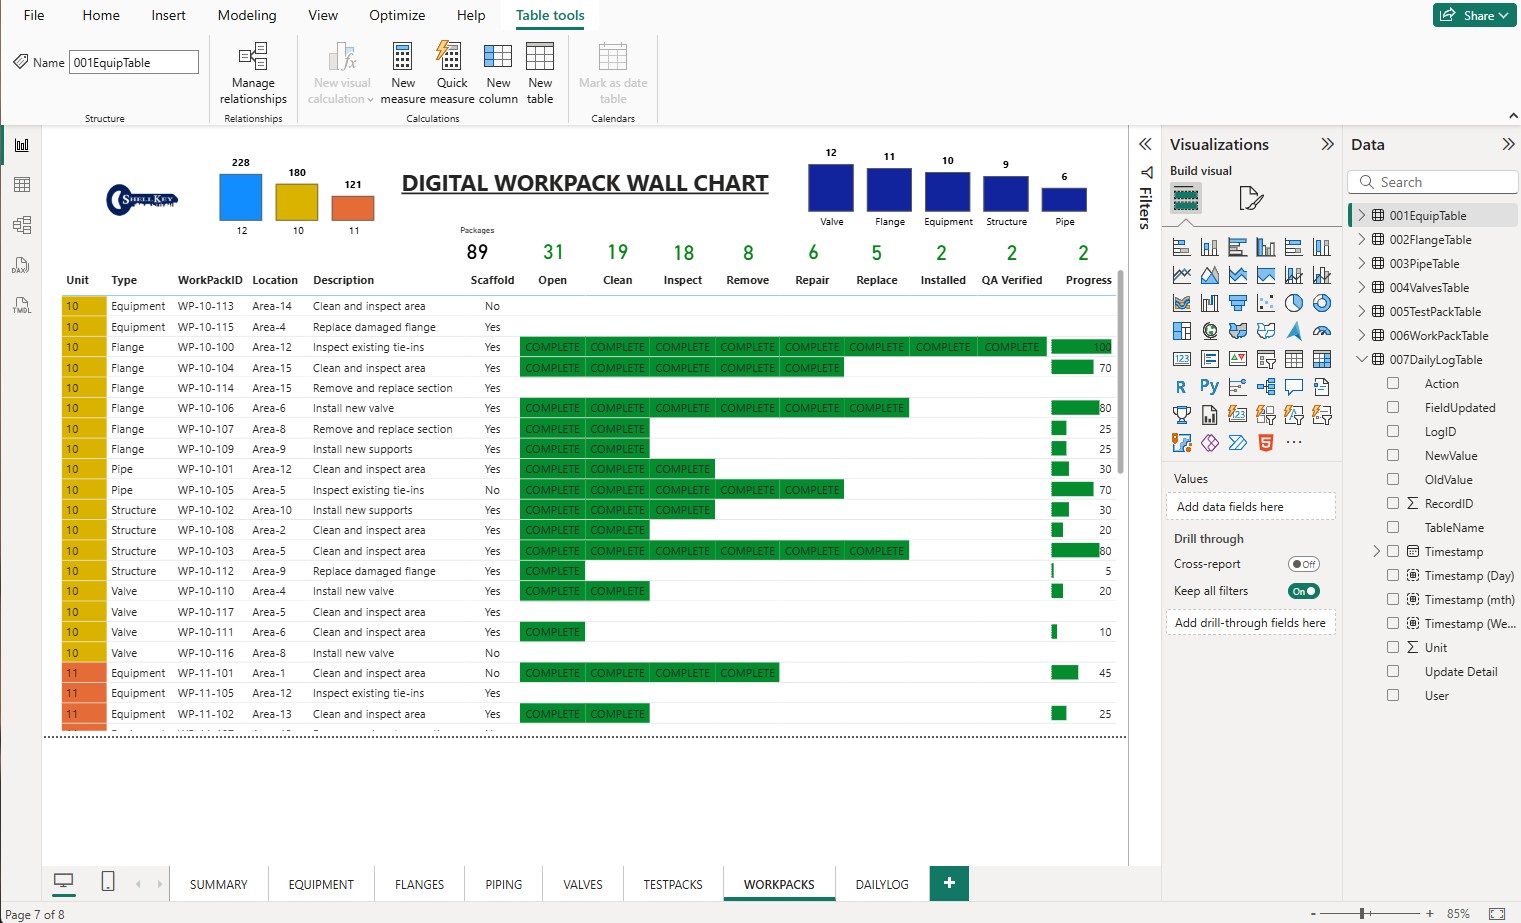
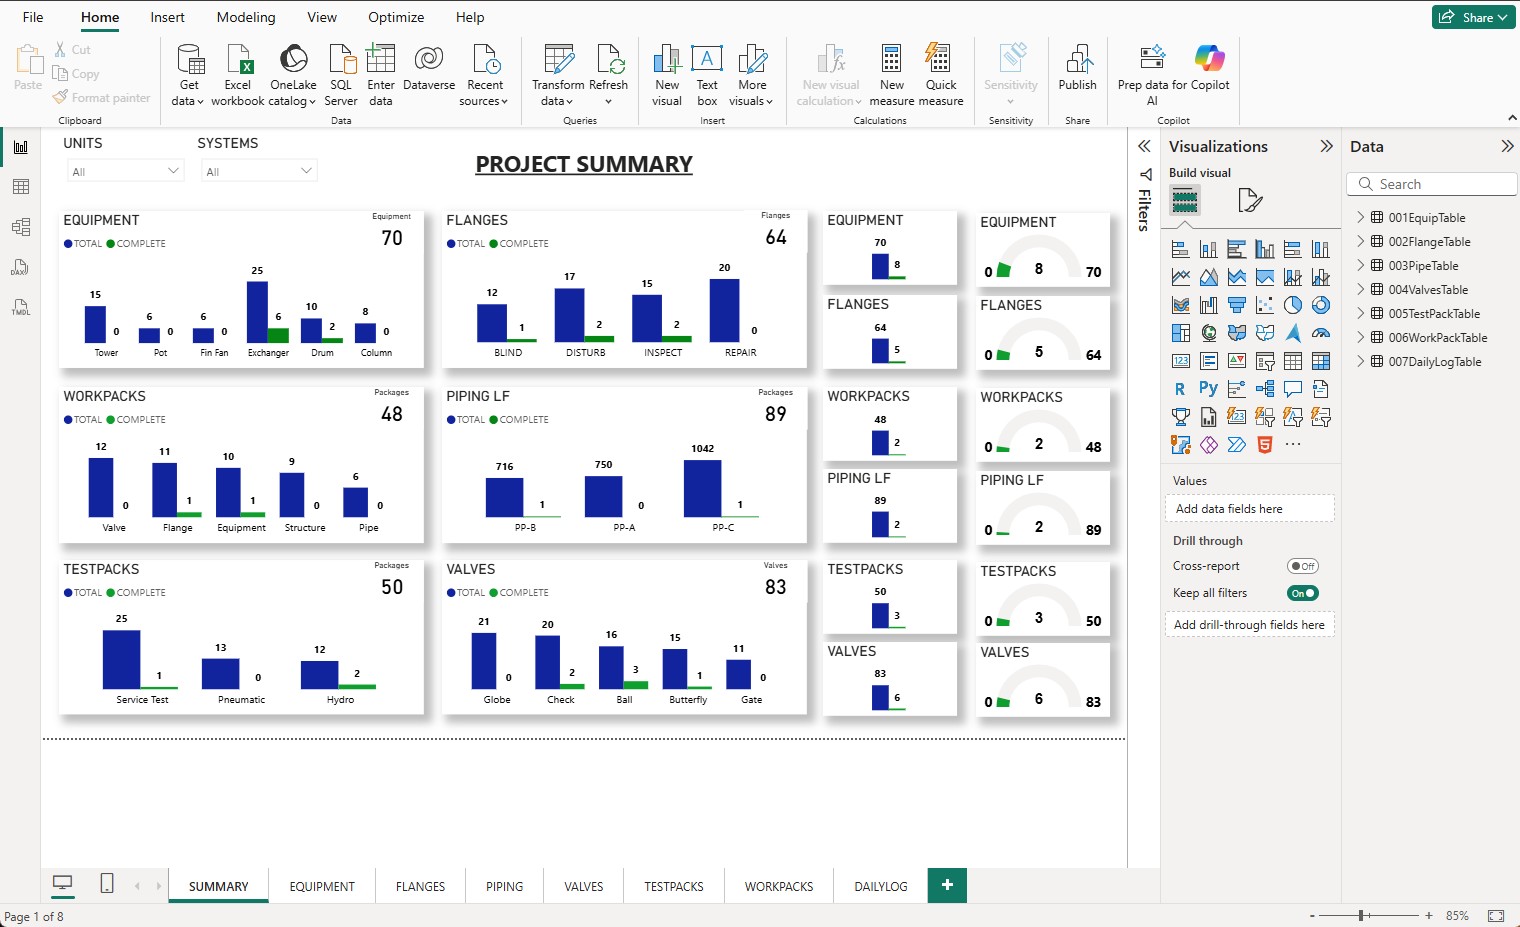
Digital Wall Charts

Click the image to view full size

Coming Soon

Digital Wall Charts

Your whole turnaround scope on one board set.

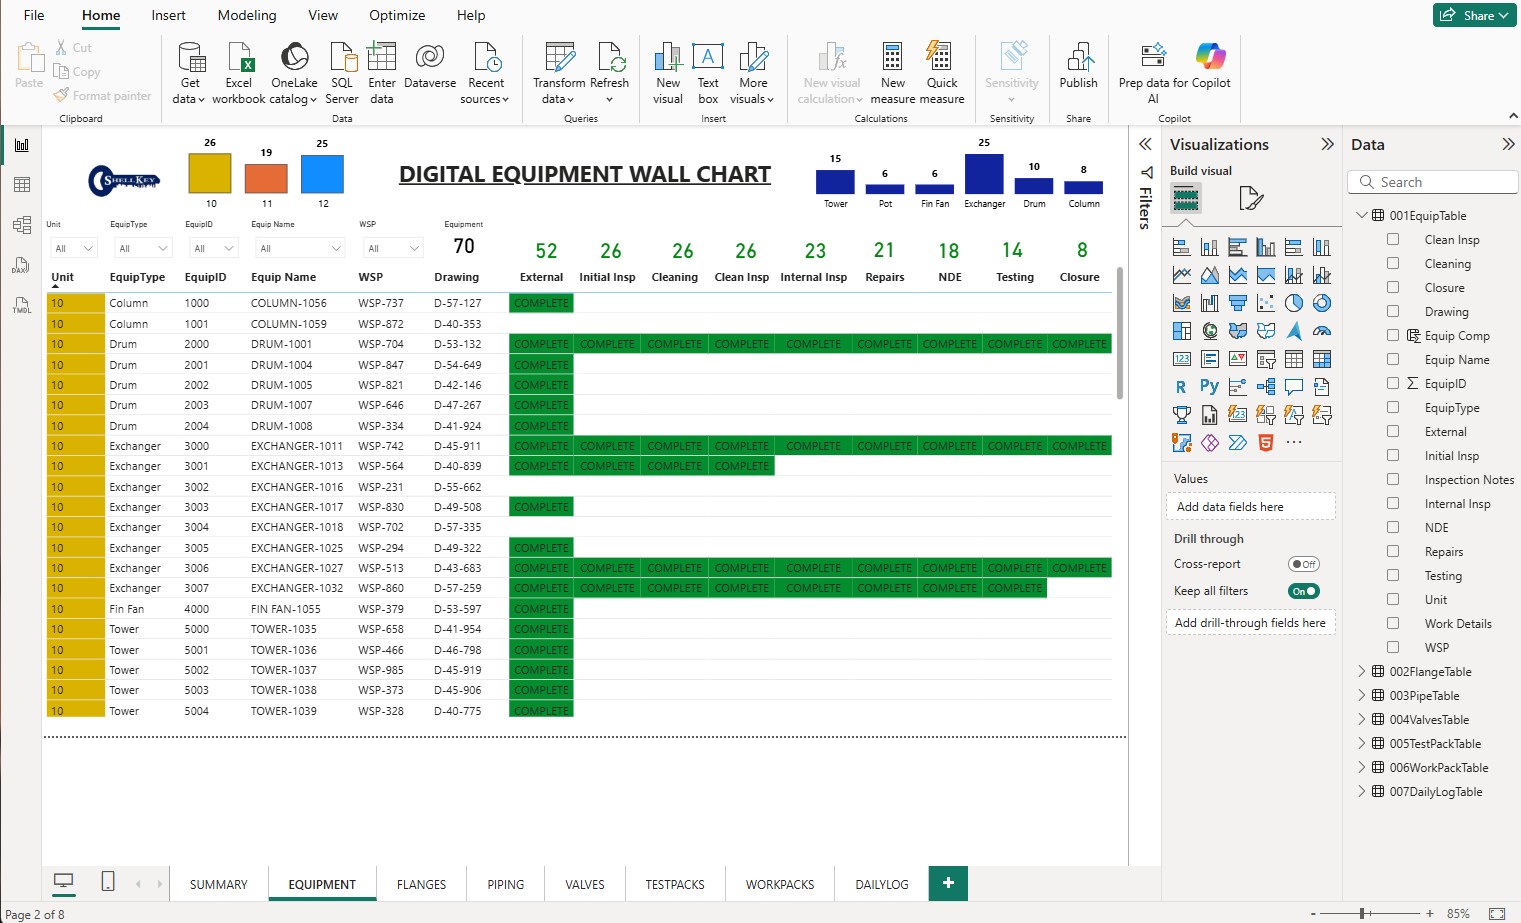
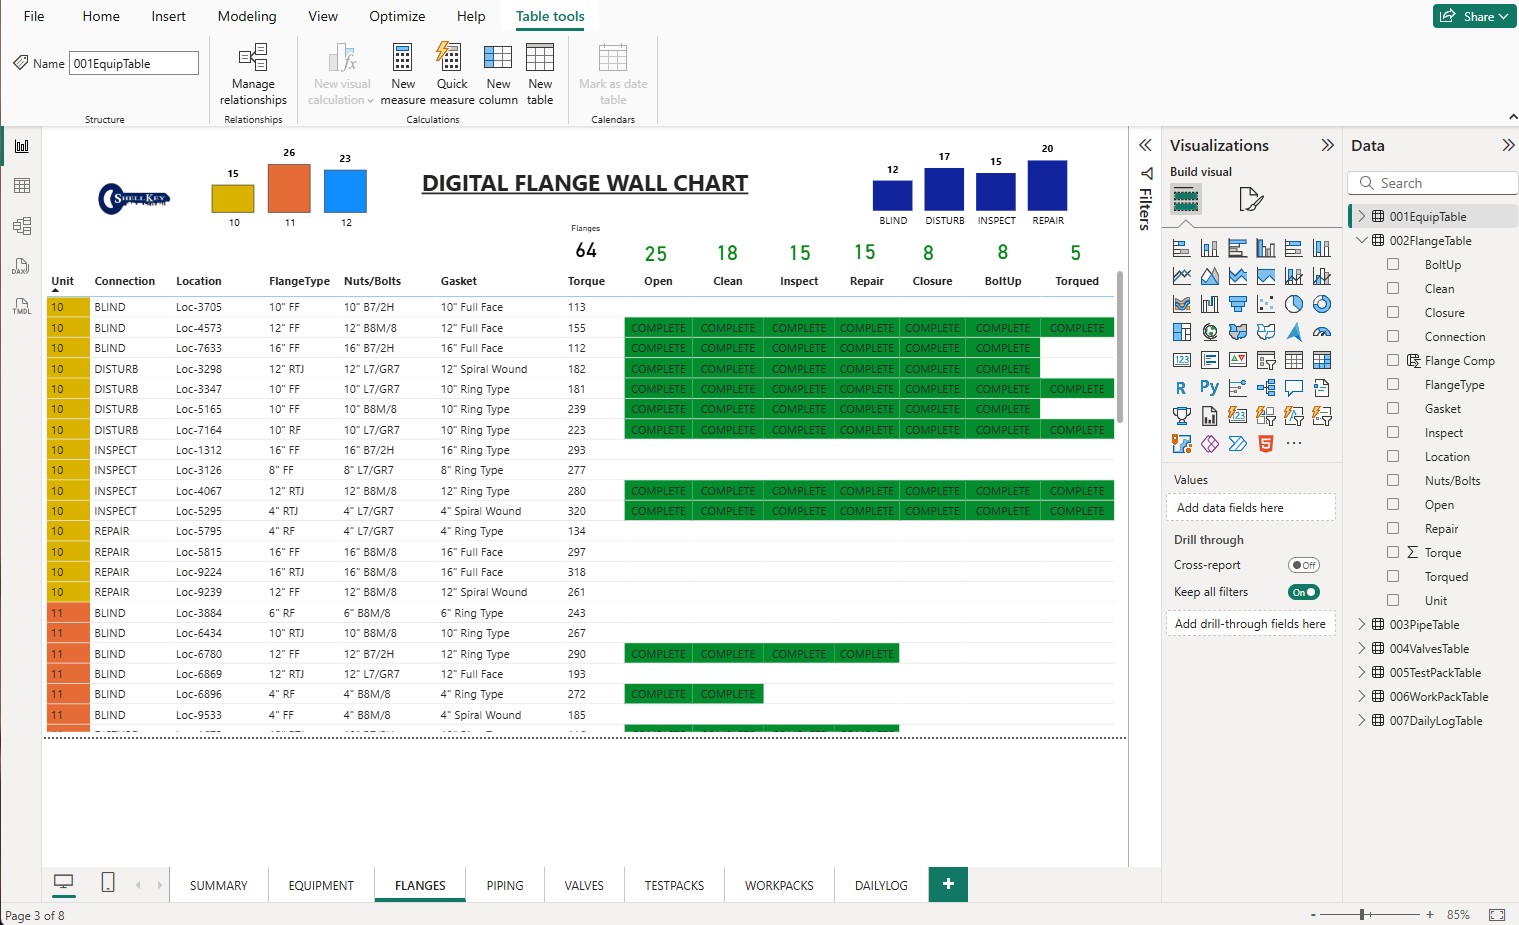
One Power BI report with eight linked views — summary, equipment, flanges, piping, valves, test packs, work packs and daily log. Every discipline, one data model, one file.

  • Eight linked views in one report
  • One shared data model — load your scope once
  • Colour-coded progress at every level
  • Sample dataset and mapping guide included
$697planned price
Request This

This one is in production. If you need it now, request it — priority builds can usually be ready within a few days.
What it is

The complete wall chart set as a single Power BI report. Eight views — Summary, Equipment, Flanges, Piping, Valves, Test Packs, Work Packs and Daily Log — all driven by one data model, so you load your scope once and every board updates together. Tab across them the way the field actually works a turnaround.

Who it is for

Turnaround teams, project controls groups and owner reps who need real completion status by discipline rather than a percentage somebody estimated on a Friday.

What you get

The .pbix file with all eight views built, a sample dataset so it renders the moment you open it, and a mapping sheet listing exactly which columns your scope export needs to contain.

What you need

Power BI Desktop, free from Microsoft. Your scope data from Excel or your tracking system — the mapping sheet lists the fields for each discipline.

Questions before you commit?

Call +1 (337) 254-8321 or email [email protected]. A real person, same day.